
Concentrated Solar Power (CSP) is a solar power method that uses mirrors to focus direct sunlight onto a receiver, heats a fluid, then uses that heat to run a turbine connected to a generator. It is the same turbine idea as classic thermal power plants, except the heat comes from the sun instead of fuel.
Pros of CSP (fast summary)
- Built-in storage fit: heat storage (often molten salt) supports power after sunset.
- Higher capacity factor than PV in many designs: long-term expectations for towers and troughs rise with storage and solar-field sizing.
- Grid-friendly output: thermal storage supports dispatch to evening peaks.
Cons of CSP (fast summary)
- Site limits: best performance needs high direct normal irradiance (DNI) and large contiguous land near transmission.
- Water and cooling tradeoffs: wet cooling raises water use; dry cooling cuts water but may reduce efficiency in hot weather.
- Costs fell, but not as fast as PV in many markets.
Efficiency snapshot (what “efficiency” often means in practice)
- PV conversion: crystalline-silicon module shipments averaged 22.7% efficiency (Q4 2024), with product ranges shown in data sheets from major makers.
- PV system losses: modern PV Performance Ratio often sits around 80% to 90% (system output vs. ideal DC output).
- CSP delivery strength: many CSP designs focus less on module-like percent conversion and more on higher capacity factor through thermal storage (tower long-term expectations and ATB ranges reflect this).
Simple CSP power-tower diagram (concept)
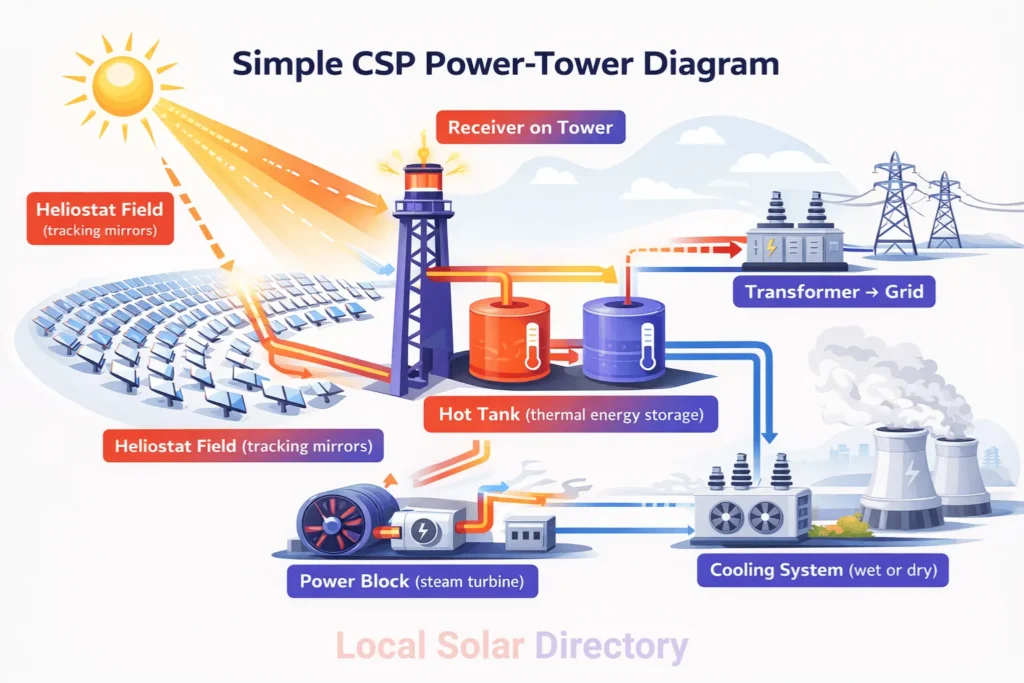
The turbine is doing its old job. The sun just replaced the boiler.
How Does Concentrated Solar Power (CSP) Work?
Concentrated Solar Power (CSP) works by concentrating direct sunlight, turning it into heat, then converting that heat into electricity through a turbine-generator set.
A typical operating sequence looks like this:
- Mirrors track the sun and focus sunlight onto a receiver.
- The receiver absorbs concentrated solar energy and heats a working fluid (heat-transfer fluid).
- Heat makes steam (often through a heat exchanger).
- Steam spins a turbine connected to a generator.
- Thermal storage (optional but common) stores hot fluid so the plant can produce electricity after sunset.
What Are the Components of CSP?
The components of CSP are the solar field, receiver, heat-transfer loop, storage (when present), and the power block that converts heat into electricity.
Core components
- Solar field: heliostats (tower) or mirror collectors (trough, Fresnel, dish).
- Receiver and absorber surfaces: the “solar energy absorption” point where concentrated sunlight becomes heat.
- Heat-transfer fluid system: piping, pumps, valves, and the hot fluid itself.
- Thermal energy storage (TES): often molten-salt tanks, sized in “hours” of output.
- Steam generator / heat exchanger: transfers heat to steam cycle.
- Power block: steam turbine, generator, condenser, controls.
- Cooling system: wet, dry, or hybrid cooling.
- Electrical system: transformer, substation tie-in, grid interconnection.
How Many Types of CSP Are There?
There are four primary configurations of CSP: parabolic trough, power tower, linear Fresnel, and dish-engine systems.
Before the table, here is what the table shows: each CSP type differs mainly in mirror geometry, where solar energy absorption occurs, typical temperature, and how easily it pairs with large thermal storage.
| CSP type | Mirror setup | Where solar energy absorption happens | Typical operating temperature | Storage fit |
|---|---|---|---|---|
| Power tower | Many heliostats aim at a central receiver | Receiver panels on tower | ~565°C (typical) | Strong fit with molten-salt tanks |
| Parabolic trough | Long curved mirrors focus on a tube | Linear receiver tube | ~390°C (typical) | Common, with slightly lower storage efficiency than tower in cited examples |
| Linear Fresnel | Rows of flatter mirrors | Elevated linear receiver | Lower than tower in many builds (varies by design) | Possible, less common than tower/trough |
| Dish-engine | Dish focuses to a point | Receiver at focal point | High local temperatures (system-specific) | Rare at utility scale |
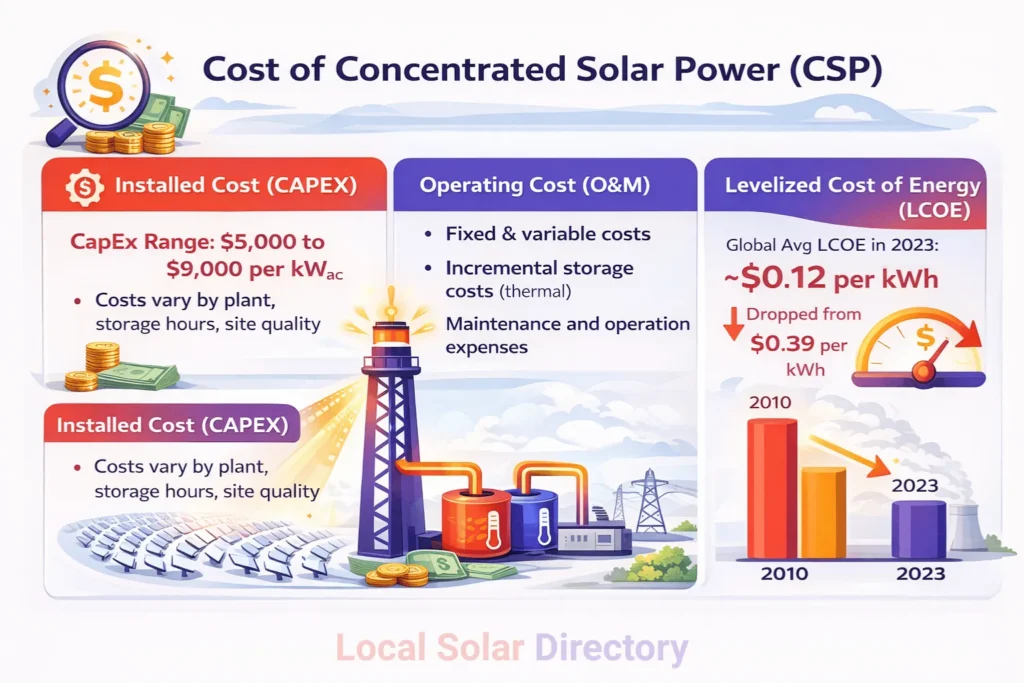
What Is the Cost of CSP?
The cost of CSP is usually reported as installed cost (CAPEX), operating cost (O and M), and levelized cost of energy (LCOE). Reported values vary by plant type, storage hours, and site quality.
Installed cost (CAPEX)
- NREL’s CSP technology summary reports an installed cost range of $5 to $9 per WAC (about $5,000 to $9,000 per kWAC), with storage capacity and solar field size as key drivers.
LCOE
- NREL’s Solar Industry Update cites IRENA data: global weighted-average CSP LCOE fell from $0.39/kWh (2010) to under $0.12/kWh (2023), tied to lower installed costs, higher capacity factors from more storage, and lower O and M.
Operating costs and storage cost hints (examples from NREL’s summary sheet)
- Fixed and variable O and M examples appear in NREL’s CSP sheet (values shown for power tower).
- Incremental storage installed cost examples appear in the same sheet, reported in $/kWh-thermal and $/kWh-electric terms.
What Is the Efficiency of CSP Compared With PV?
The efficiency of CSP compared with PV depends on whether you mean (1) conversion efficiency, (2) system losses, or (3) annual energy delivery (capacity factor).
Before the table, here is the point: PV tends to lead on direct sunlight-to-electric conversion at the module level, while CSP tends to compete through thermal storage that raises capacity factor and shifts output to high-value hours.
| Metric | CSP (typical reported indicators) | PV (typical reported indicators) |
|---|---|---|
| Conversion at the “front end” | Heat engine limited by thermodynamics; higher receiver temperature helps (tower listed ~565°C; trough ~390°C). | Crystalline-silicon modules: 22.7% weighted-average shipment efficiency (Q4 2024); range in product data sheets extends higher and lower. |
| System losses metric | Storage round-trip efficiency examples: 99% (tower molten salt) and 90% (trough) in cited cases. | Performance Ratio often 80% to 90% today (system output vs ideal DC). |
| Capacity factor (energy delivery over the year) | NREL sheet shows long-term expectations: tower 42% to 59%, trough 28% to 38% (configuration-dependent). | Strongly location-dependent; PV lacks built-in thermal storage, so evening delivery often needs batteries or grid support. (PV cost benchmarks and LCOE comparisons commonly treat PV and storage together.) |
What Is the Difference Between CSP and PV?
The difference between CSP and PV is that CSP converts sunlight to heat first and then to electricity with a turbine, while PV converts sunlight directly into electricity in semiconductor cells.
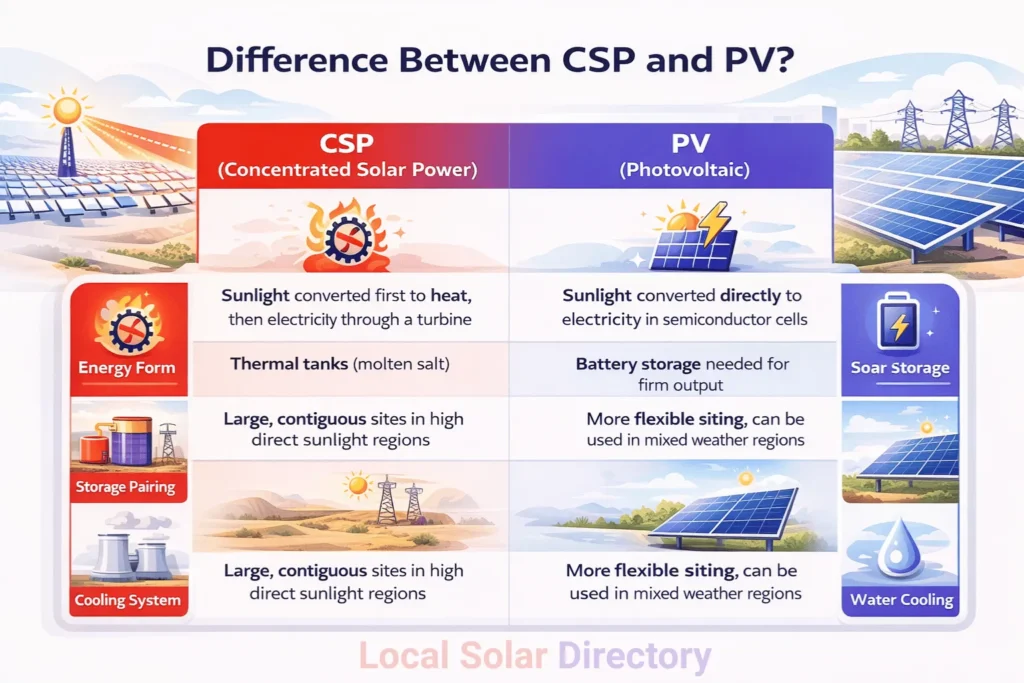
Key technical differences:
- Energy form: CSP starts as heat; PV starts as electricity.
- Storage pairing: CSP pairs naturally with thermal tanks; PV pairs with batteries when firm output matters.
- Siting: CSP depends heavily on direct sunlight and large sites; PV is more flexible across climates.
- Water and cooling: CSP often uses more operational water than PV, especially with wet cooling; dry cooling reduces water use but changes performance.
- Land use: utility-scale land needs overlap, but ranges differ by tech and layout.
What Are the Advantages and Disadvantages of CSP?
Advantages of CSP are dispatch-friendly output through thermal storage, higher capacity factor in many storage-equipped designs, and a proven turbine-generator path that grid operators already know well.
Disadvantages of CSP are stricter siting needs (high DNI, contiguous land, transmission access), water and cooling tradeoffs, and slower cost declines versus PV in many markets.
Advantages (more detail)
- Thermal storage fit: molten-salt tanks store heat for evening generation.
- Higher capacity factor potential: depends on storage and solar field size; ATB and NREL note higher capacity factors than PV in many configurations.
- Grid services value: storage supports shifting output and related grid value streams (noted in NREL’s sheet).
Disadvantages (more detail)
- Water use: NREL’s dry-cooling examples show 26 gal/MWh (tower) and 78 gal/MWh (trough), while wet cooling commonly raises consumption beyond dry cooling.
- Land and transmission: site requirements include low slope and proximity to substations.
- Economics vs PV: PV LCOE ranges in widely cited market reports often sit below CSP in many cases, especially where storage needs are modest.
What Are the Applications of CSP?
The applications of CSP are utility-scale electricity generation, evening peak support through thermal storage, and high-temperature heat that can serve industrial processes in certain designs.
Common application buckets:
- Dispatchable renewable electricity: CSP plus storage shifts solar energy into late-day demand hours.
- Grid support in high-DNI regions: capacity factor rises with storage and solar field sizing.
- Industrial heat concepts and long-duration thermal storage pilots: NREL highlights demonstration work such as high-hour thermal storage concepts for heat and electricity.
Do We Need CSP or PV for the Long Term?
For the long term, many power system build-outs treat PV as the dominant source of new solar capacity, while CSP remains a niche option where dispatchable solar output from thermal storage matches grid needs and site conditions.
What current planning signals show:
- PV growth dominates many markets: Lazard’s reported LCOE ranges for utility PV ($38 to $78/MWh) and PV plus storage ($50 to $131/MWh) reflect why PV appears frequently in new-build comparisons.
- Near-term U.S. build mix expectations: NREL’s industry update cites EIA projections that most new capacity in the next two years is PV, batteries, and wind.
- CSP role depends on location and design: CSP performance hinges on storage hours, solar field sizing, DNI, cooling choice, and interconnection proximity.
A practical way to decide (fact-based checks):
- High DNI desert site + evening peak value + low water option: CSP with dry cooling and thermal storage enters the shortlist.
- Mixed weather or space limits + fastest cost declines: PV (often with batteries where firm output matters) tends to dominate build plans.
What Is the Amount of CSP Deployment Around the World?
The amount of CSP deployment around the world reached 6,868 MW (6.868 GW) of installed capacity in 2024, based on IRENA capacity statistics.
Before the table, here is what it shows: CSP capacity remains concentrated in a small set of countries, with Spain and the United States as long-time leaders, and recent growth centered in a few high-sun regions.
| Region or country | CSP capacity in 2024 (MW) |
|---|---|
| World | 6,868 |
| Europe | 2,307 |
| Spain | 2,302 |
| North America | 1,497 |
| United States | 1,480 |
| Middle East | 944 |
| United Arab Emirates | 600 |
| Israel | 242 |
| Asia | 918 |
| China | 570 |
| India | 343 |
| Africa | 1,085 |
| Morocco | 540 |
| South Africa | 500 |
| South America | 114 |
| Chile | 114 |
A simple trend from the same dataset: global CSP rose from 4,850 MW (2015) to 6,868 MW (2024), an increase of 2,018 MW across the period.