
A photovoltaic (PV) system converts sunlight into electricity using semiconductor solar cells, producing DC power that is converted to usable AC power (for buildings or the grid) through an inverter. Modern PV is deployed at multi‑terawatt scale worldwide: cumulative installed PV reached about 2,156.5 GW (≈2.16 TW) by end‑2024, and the PV installation market reached about 602 GW in 2024.
PV quick facts that drive real-world design decisions
| Parameter | Typical / reported value | Why it matters |
|---|---|---|
| Typical PV system design lifetime | ~25 years | Common baseline for yield, warranties, and lifecycle metrics. |
| Average annual degradation (energy or power) | ~0.70% per year | Used for long-term yield and financial modeling. |
| Typical performance ratio (PR) today | ~0.80–0.90 | Summarizes “all losses” from modules to delivered energy. |
| Commercial mono‑Si module efficiency (today) | >24% (commercial), 26% (best lab module) | Sets area needed and energy density. |
| Module power range enabled by larger wafers | up to ~750 W/module | Impacts string counts, racking, and BOS costs. |
| Global PV electricity share (world, gross) | ~6.8% in 2024 | Indicates PV penetration and grid-integration needs. |
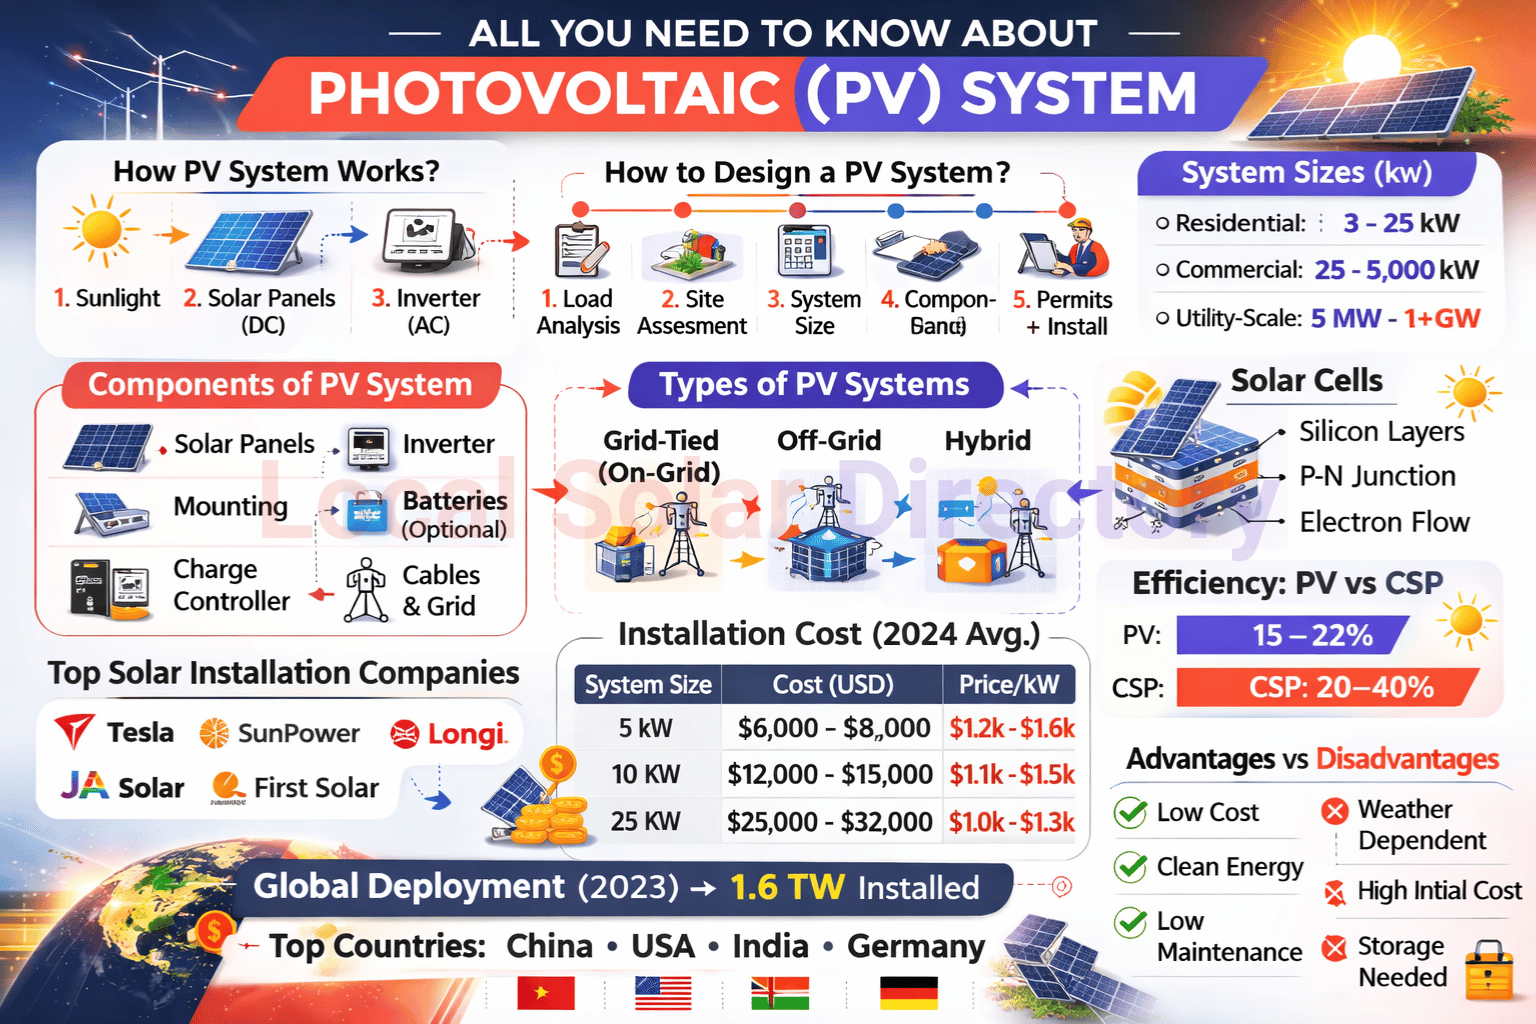
How Do Photovoltaic (PV) Systems Work?
A photovoltaic (PV) system works by turning sunlight into DC electricity inside solar cells and then converting that DC into AC electricity through an inverter for on-site use or grid export.
The physical + electrical chain (no skipped steps)
- Photons hit a solar cell → the semiconductor absorbs light and creates charge carriers.
- The cell’s internal electric field separates charges → current flows through an external circuit (DC).
- Cells are wired into modules; modules into strings/arrays → voltage increases in series, current increases in parallel.
- DC power is conditioned and protected → fuses/breakers, disconnects, surge protection, grounding.
- Inverter converts DC→AC and synchronizes with the grid → also performs Maximum Power Point Tracking (MPPT).
- Metering + monitoring measure energy flows → production, consumption, export/import (and battery charge/discharge if present).
What makes PV output go up or down (quantitative, design-useful)
- Irradiance mainly sets current (clouds and shading reduce output quickly).
- Temperature mainly reduces voltage (hotter modules yield less power; “temperature coefficient” is a module spec used in yield models).
- System losses aggregate into PR (wiring, mismatch, inverter conversion, downtime, soiling). Typical PR values today are about 0.80–0.90.
- System derate (pre‑inverter) in benchmark models is often in the mid‑80% range (meaning ~14% losses before inversion in that benchmark configuration).
How to Design Photovoltaic (PV) Systems?
To design a photovoltaic (PV) system, you size the PV array, inverter, and (if used) storage to meet a defined energy target under local solar resource and loss assumptions, while meeting electrical, structural, and safety codes.
A practical design workflow engineers use
- Define the target
- Annual energy (kWh/year) or monthly bill offset (%).
- Peak power needs (kW) if batteries/back‑up are included.
- Lock the site constraints
- Usable area (roof or land), orientation, tilt range, shading windows, wind/snow loads.
- Utility interconnection limits (export cap, transformer size, protection requirements).
- Pick architecture first (it changes everything)
- Grid‑tied, off‑grid, or hybrid.
- Inverter choice: string/central vs microinverters (and whether optimizers are needed due to mismatch or complex roofs).
- Estimate production using the yield identity
Annual Energy ≈ (DC Size) × (Annual Peak-Sun-Hours) × (PR)- PR commonly lands around 0.80–0.90 for well-designed systems.
- Size the inverter using DC/AC ratio (ILR)
- Rooftop benchmarks show ILR around ~1.21–1.23 in recent years.
- Utility benchmarks commonly use higher ILR; one-axis tracker ILR is ~1.34 in recent benchmark assumptions.
Higher ILR reduces inverter cost per Wdc but increases clipping on high-irradiance hours; the “best” ILR depends on irradiance profile, curtailment risk, and tariff structure.
- Do string sizing (electrical correctness check)
- Verify cold‑temperature Voc does not exceed max DC voltage (600 V / 1000 V / 1500 V class depends on design).
- Verify Vmp stays inside MPPT voltage range at operating temperatures.
This step prevents nuisance trips, inverter damage, and underperformance.
- Model losses explicitly (so PR is not a guess)
Typical loss buckets: module temperature, soiling, mismatch, DC wiring, inverter efficiency, AC wiring, availability. Benchmark inverter efficiencies in utility configurations are around the mid-to-high 90% range in modeling assumptions. - Plan protection + compliance
- DC/AC disconnects, fusing, rapid shutdown where applicable, surge protection, labeling, grounding.
- Commissioning tests (insulation resistance, polarity, functional protection checks, monitoring validation).
Example sizing (numbers you can reuse)
Target: 10,000 kWh/year
Resource: 4.5 peak-sun-hours/day average
Assumed PR: 0.80 (within typical modern ranges)
DC size (kWdc) ≈ 10,000 / (4.5×365×0.80) ≈ 7.6 kWdc
That result aligns with common residential benchmark system sizes (recent U.S. benchmark residential system size is ~7.9 kWdc).
Area reality check (module area only)
At ~200–220 W per m² (≈20–22% module efficiency at STC), 7.6 kWdc corresponds to roughly 35–40 m² of module area, before walkways/setbacks and layout constraints.
What Are the Components of a Photovoltaic (PV) System?
The components of a photovoltaic (PV) system are the PV array (modules), mounting/structure, inverters, wiring and protection equipment, and monitoring; batteries and charge controllers are added for storage and off-grid capability.
Component map (what each part actually does)
| Component | Function | Design-impacting numbers / notes |
|---|---|---|
| PV modules (array) | Convert sunlight → DC power | Module sizes now allow up to ~750 W/module in mainstream formats. |
| Mounting / racking | Holds modules at tilt/orientation | Fixed tilt vs tracking changes energy yield and O&M approach. |
| Inverter(s) | DC→AC conversion + grid sync + MPPT | Utility benchmark inverter efficiency values are modeled around ~96% in some standard configurations. |
| DC combiner / string protection | Consolidates strings; fusing/monitoring | Used heavily in larger systems. |
| AC switchgear / protection | Grid interface, breakers, relays | Sized to fault currents and interconnection rules. |
| Monitoring (SCADA / portal) | Measures kWh, PR, alarms | Needed for performance guarantees and O&M. |
| Battery + PCS (optional) | Shifts energy in time; backup | Changes design from “energy-only” to “energy + power” sizing. |
Reliability inputs commonly used in lifecycle calculations
- 25-year lifetime and ~0.70% annual degradation are commonly used in lifecycle energy and impact analyses.
What Are Solar Cells?
Solar cells are semiconductor devices that convert sunlight directly into DC electricity through a p–n junction that separates photo-generated charges and drives current through an external circuit.
Solar cell performance is defined by four numbers
- Isc (short-circuit current)
- Voc (open-circuit voltage)
- Fill Factor (FF)
- Efficiency η = Pmax / (Irradiance × Area)
Technology reality (what dominates production vs what sets records)
- Silicon wafer-based PV dominates manufacturing: crystalline silicon is about 98% of production (2024).
- Record lab efficiencies (selected): 47.6% for III–V multijunction (concentrator), 27.8% mono‑Si, 26.9% perovskite, 23.4% CIGS, 21.0% CdTe.
- Commercial module efficiency trends: mono‑Si commercial modules increased from about 16% to >24% across roughly the last decade; CdTe modules rose from about 9% to ~20%.
How Many Types of Photovoltaic (PV) Systems Are There?
Photovoltaic (PV) systems have three main grid-connection types—grid-tied, off-grid, and hybrid—and several physical deployment types (rooftop, ground-mount, floating PV, agrivoltaics, and building-integrated PV).
Grid-connection types (the “big 3”)
- Grid‑tied PV
Delivers solar electricity to loads and exports surplus to the grid; storage is optional. - Off‑grid PV
Runs without a utility grid; requires storage (battery) and usually backup generation for long low-sun periods. - Hybrid PV (grid + storage)
Combines PV with batteries to reduce peak demand, improve self-consumption, and provide backup.
Physical deployment types (where PV actually gets installed)
- Rooftop / building-mounted (homes, C&I buildings)
- Ground-mounted utility-scale
- Agrivoltaics (shared land use with agriculture)
- Floating PV (water bodies)
- Vehicle-integrated PV (emerging market segment)
What Are the Sizes of Photovoltaic (PV) Systems?
Photovoltaic (PV) system sizes range from watt-level portable products to multi-gigawatt utility fleets; common categories include residential (~3–15 kW), commercial/industrial (~30 kW to several MW), and utility-scale (tens of MW to >1,000 MW).
Size bands with practical meaning (kW ↔ area ↔ use case)
| Segment | Typical size | Typical use |
|---|---|---|
| Plug-in / small | ~0.05–1 kW | Small loads, camping, kiosks |
| Residential rooftop | ~3–15 kW | Home electricity offset + optional battery |
| Small commercial | ~15–200 kW | Shops, offices, warehouses |
| Large C&I / campus | ~0.2–5 MW | Factories, campuses, logistics |
| Utility-scale | ~5 MW to 1,000+ MW | Grid supply, PPAs, tenders |
Benchmark anchoring (real numbers used in cost models)
- Recent U.S. benchmark residential size is ~7.9 kWdc.
- Recent benchmark “commercial” model configuration uses ~3,000 kWdc (3 MWdc) in the latest-year assumption set.
What Are Solar System Installation Companies?
Solar system installation companies are licensed firms that design, procure, and install PV systems and typically handle permitting, inspection, interconnection, commissioning, and warranty service, operating as local installers, national installers, or utility-scale EPC contractors. 12 Top Solar Pv System Installation Companies.
The main company roles in the PV value chain
- Residential/C&I installers: site survey → design → install → commissioning.
- Solar retailers (common in some markets): sell the system and subcontract accredited installers.
- Utility-scale EPC (Engineering, Procurement, Construction): build MW–GW plants, including civil works, electrical balance of plant, and grid connection.
- Developers/IPP: finance + own assets and contract EPC + O&M.
- O&M providers: long-term cleaning, inspection, performance monitoring, corrective maintenance.
Some of installation/EPC companies (by market; examples change over time)
Pakistan (utility scale and C&I EPC example list)
In Pakistan, a practical “who builds big systems” example list includes Reon Energy, Shams Power, Premier Energy, and SkyElectric. Reon’s public customer notes cite a 59 MW solar project for Bestway Cement and 70 MW total across Bestway sites, and Reon’s 2025 release cites a 20.7 MW solar plant paired with a 22.76 MWh battery system for Lucky Cement.
Africa (regional EPC example list)
Africa is a continent, so EPC “top lists” vary by country, but you can cite regionally active EPCs and projects without guessing a single national ranking. Recent utility scale examples include POWERCHINA signing an EPC contract for a 342 MW solar plant in South Africa, and Sterling and Wilson Renewable Energy winning a 240 MW AC solar EPC contract in South Africa; sub Saharan examples include Metka EGN delivering a 10 MW solar plant in Uganda, while JUWI has announced EPC work totaling 340 MW across three private solar projects in South Africa. For C&I, firms like Starsight Energy and Daystar Power operate across multiple African countries.
Malaysia (utility scale EPC example list)
In Malaysia, a credible EPC example list for large scale and C&I solar includes Solarvest, Samaiden, Plus Xnergy, and Nefin V Power. A recent market cited datapoint is Samaiden securing an RM108.6 million EPCC award for a 29.99 MWac large scale solar project, and Plus Xnergy has been reported in Malaysian procurement coverage tied to 29.99 MW AC project EPC activity under the CGPP framework.
Philippines (utility scale EPC example list)
In the Philippines, a current utility scale reference point is the Terra Solar project, where China Energy Engineering Group (Energy China) has been publicly named as EPC in project announcements; project size has been described at 3,500 MWp solar with 4,500 MWh of battery storage in contractor notes. Supporting local or specialist EPC examples include MIESCOR (noted for grid interconnection EPC scope on Terra Solar) and Manila based PV EPC firms like Ayroso Energy Solutions; for rooftop and industrial systems, firms like EEI Power Corporation publish solar installation case notes.
Saudi Arabia (utility scale EPC and accreditation example)
In Saudi Arabia, one recent utility scale EPC datapoint is POWERCHINA reporting EPC contracts under Round 5 of the National Renewable Energy Program for the MAS (1,250 MW) and AHK2 (500 MW) PV projects in Riyadh, with an expected 4.4 billion kWh/year generation estimate in that release. For distributed PV, market governance examples include the national utility publishing “certified contractor/consultant” guidance pages, and trade coverage citing the regulator qualifying 106 contractors and consultants for distributed PV up to 2 MW.
Nigeria (solar EPC and installer example list)
In Nigeria, a workable EPC and installer example list includes Starsight Energy, Daystar Power, Yuri Energy, EcoSolar International, Rubitec Solar, Blue Camel Energy, and Auxano Solar. For a hard number you can place on a chart, Starsight publishes an “at a glance” snapshot stating 235 MW installed generating capacity and 83 MWh installed battery capacity; several of the other firms explicitly market turnkey solar delivery, engineering, or EPC services in Nigeria.
Here is a compact set of “one number per label” anchors you can drop into a chart or callout.
| Place | Simple anchor metric you can chart | Example EPC / installers to list beside it |
|---|---|---|
| Pakistan | 59 MW (Bestway site example) | Reon, Shams Power, Premier Energy, SkyElectric |
| Africa (regional) | 342 MW (South Africa EPC example) | POWERCHINA, Sterling and Wilson, JUWI, Metka EGN, Starsight, Daystar |
| Malaysia | 29.99 MWac (recent EPCC example) | Solarvest, Samaiden, Plus Xnergy, Nefin V Power |
| Philippines | 3,500 MWp solar (Terra Solar reference) | Energy China, MIESCOR, Ayroso, EEI Power |
| Saudi Arabia | 1,250 MW and 500 MW (Round 5 EPC examples) | POWERCHINA plus the local certified contractor pool |
| Nigeria | 235 MW installed (C&I fleet snapshot) | Starsight, Daystar, Yuri Energy, EcoSolar, Rubitec, Blue Camel, Auxano |
Installer selection checklist (objective checks)
- Licensing + accreditation (electrician license, PV accreditation, relevant national scheme).
- Design documentation: single-line diagram, stringing plan, shading assessment, safety labeling plan.
- Equipment datasheets: module + inverter certifications, warranty terms, compatibility.
- Commissioning evidence: insulation resistance test, polarity verification, monitoring commissioning, protection device verification.
- Warranty clarity: workmanship vs equipment warranties, service response time, parts availability.
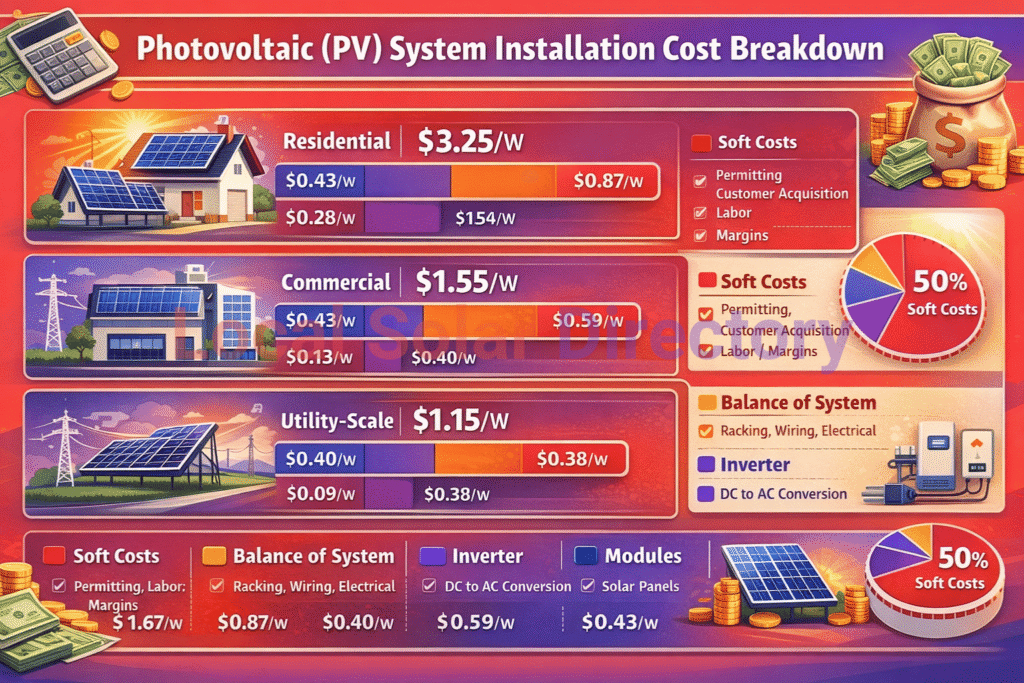
What Is the Installation Cost of a Photovoltaic (PV) System?
Installation cost of a photovoltaic (PV) system typically ranges from about $1–$4 per Wdc depending on size and market, with utility-scale lowest and residential highest; recent U.S. benchmark “overnight” installed costs for 2024 are about $3.25/Wdc (residential), $1.55/Wdc (commercial), and $1.15/Wdc (utility-scale) in 2024 USD.
Cost benchmarks (structured, comparable)
U.S. benchmark (overnight installed cost, 2024 USD)
| Segment | Benchmark installed cost (2024) |
|---|---|
| Residential PV | $3.25/Wdc |
| Commercial PV | $1.55/Wdc |
| Utility-scale PV | $1.15/Wdc |
Global utility-scale context (IRENA cost database, 2024)
- Global weighted average total installed cost for solar PV in 2024 is reported at about USD 691/kW (≈ $0.691/W), and global weighted average LCOE for new utility-scale solar PV at USD 0.043/kWh.
Germany (rooftop price example)
A reported German price range for a 3–10 kWp rooftop system is about 900–1,300 €/kWp (2024).
Cost example (turning $/W into a real project number)
- 7.9 kWdc residential system at $3.25/Wdc → ≈ $25,675 (benchmark “overnight” installed cost, before incentives/financing).
- 100 MWdc utility-scale system at $1.15/Wdc → ≈ $115 million (overnight installed cost).
Operating & maintenance (O&M) costs (benchmark values)
Benchmark O&M expense assumptions in a 2010–2024 U.S. benchmarking dataset include, for 2024, approximately $35/kWdc‑yr (residential) and $20/kWdc‑yr (commercial and utility).
What drives cost differences (the consistent drivers)
- Soft costs (customer acquisition, permitting, interconnection, labor) dominate residential cost structure more than utility-scale.
- Economies of scale reduce overhead per watt in utility-scale plants.
- Module pricing is only one part of installed cost; global average selling price is reported around $0.13/Wp in 2024 for modules (module-only price, not installed).
- Interconnection and land/civil works can dominate in constrained grids and large projects.
What Is the Efficiency of a Photovoltaic (PV) System Compared to CSP?
Efficiency of photovoltaic (PV) systems is typically higher at the module conversion step (commercial mono‑Si modules exceed 24% efficiency), while CSP systems often achieve higher plant capacity factors because thermal storage and turbine operation can extend generation beyond sunny hours.
PV (electric conversion efficiency + system performance)
- Commercial mono‑Si modules increased from ~16% to >24% over ~10 years; best lab modules reach ~26%.
- Real plants are better described by PR, where typical PR today is ~0.80–0.90.
- Global weighted average capacity factor in IRENA’s cost dataset is ~17% for solar PV (2024).
CSP (dispatchability and capacity factor)
- Global weighted average capacity factor in IRENA’s cost dataset is ~41% for CSP (2024).
- NREL’s CSP technology basics indicates long-term capacity factor expectations of ~42–59% for power towers and ~28–38% for parabolic trough systems, with storage configuration as a key driver.
Cost context (often confused with efficiency, but critical for technology choice)
- IRENA reports 2024 global weighted average installed costs of ~$691/kW (PV) vs ~$3,677/kW (CSP), and LCOE $0.043/kWh (PV) vs $0.092/kWh (CSP).
What Is the Difference Between Photovoltaic (PV) Systems and Solar Thermal Energy?
The difference between photovoltaic (PV) systems and solar thermal energy is that PV converts sunlight directly into electricity, while solar thermal systems convert sunlight into heat (for hot water/space/process heating) or into electricity via a heat engine in CSP plants.
Side-by-side comparison (PV vs solar thermal heat vs CSP)
| Attribute | PV (Photovoltaic) | Solar thermal (heat) | CSP (solar thermal electricity) |
|---|---|---|---|
| Output | Electricity (DC→AC) | Heat (hot water/steam) | Electricity (turbine-generator) |
| Main collector | Semiconductor cells | Thermal collectors (flat plate, evacuated tube, etc.) | Mirrors + receiver + heat-transfer fluid |
| Storage | Batteries (electrical) | Hot water tanks / thermal storage | Thermal storage (often molten salt) |
| Best-fit use | Distributed + utility electricity | Domestic/industrial heat | Utility electricity with dispatchability |
What Are the Advantages and Disadvantages of Photovoltaic (PV) Systems?
Advantages of photovoltaic (PV) systems include low lifecycle emissions and modular scalability, while disadvantages include variable output without storage and ongoing needs for grid integration, land/roof area, and end‑of‑life handling.
Advantages (fact-based, numeric where possible)
- Low lifecycle greenhouse-gas emissions: median life-cycle value for PV is reported around 43 gCO₂e/kWh, far below fossil electricity (e.g., coal in the same table at ~1000 gCO₂e/kWh scale).
- Fast energy payback: PV systems manufactured in Europe and installed in Northern Europe show energy payback around ~1.1 years, and around ~0.9 years in Southern Europe in Fraunhofer ISE’s synthesis; Sicily example is about ~1 year.
- Improved operational performance: performance ratio improved from ~70% (before 2000) to ~80–90% today in the Fraunhofer ISE summary.
- Very large cost learning effects in hardware: global average module selling price reported around $0.13/Wp in 2024 (module-only price).
- Scalable deployment: PV is deployed from small rooftops to multi‑hundred‑GW annual markets.
Disadvantages (fact-based, numeric where possible)
- Variable generation profile: the global weighted average capacity factor for PV in a utility-scale cost dataset is ~17% (2024), so capacity contribution depends on location and coincidence with demand.
- Degradation over time: average degradation is commonly modeled around ~0.70% per year.
- Grid integration requirements scale with penetration: higher PV shares increase the importance of flexibility (storage, demand response, grid expansion); Fraunhofer explicitly highlights the growing importance of batteries and energy management with increasing renewable share.
- End-of-life processing is still developing: PV modules are recyclable and can recover valuable materials, but Fraunhofer notes additional R&D is required to make recycling more in-depth and cost-effective.
What Are the Applications of Photovoltaic (PV) Systems?
Applications of photovoltaic (PV) systems include rooftop self-consumption, commercial and industrial power supply, utility-scale grid generation, off-grid electrification, microgrids, water pumping, telecom sites, and pairing with storage for resilience and peak management.
High-frequency applications (most common in deployed capacity)
- Rooftop PV for homes and small businesses (often combined with batteries and EV charging in high-tariff markets).
- Commercial & industrial PV for cost reduction and predictable daytime load coverage.
- Utility-scale PV supplying grids through PPAs and auctions; PV is now the dominant source of new renewable additions in annual capacity data.
Specialized applications (where PV is often the lowest-logistics option)
- Remote power for telecom towers, sensors, and monitoring stations
- Solar water pumping for agriculture
- Microgrids (PV + storage + generator) for islands and weak-grid areas
How Much Photovoltaic (PV) Capacity Is Deployed Around the World?
Worldwide deployment of photovoltaic (PV) systems reached about 2,156.5 GW cumulative capacity by end‑2024, with about 602 GW installed in 2024, and global PV generation about 2,111.7 TWh in 2024.
Deployment scale (global, 2024)
- PV electricity share (world, gross): ~6.8% in 2024.
- Regional shares of cumulative PV (2024): Europe ~18%, China ~48%, North America ~10%.
Why global “annual additions” numbers differ across reports (AC vs DC)
- IRENA’s capacity additions in this cost dataset are explicitly AC (net generating capacity), reporting solar PV additions of 452.1 GW in 2024.
- Industry market figures often report DC (Wp). Fraunhofer’s 2024 PV installation market is 602 GW.
- The gap is consistent with typical DC/AC ratios: a benchmark utility one-axis tracker ILR is ~1.34, so 452 GWac × 1.34 ≈ 606 GWdc, close to the 602 GW market number.
Concentration of new additions (2024)
China alone accounts for 61.2% of global PV additions (276.8 GWac) in IRENA’s 2024 capacity-additions accounting.